Struggling to know which metrics drive real improvement? Unlock operational excellence by tracking the right Logistics KPIs for Performance, it’s time to elevate every shipment, carrier, and route.
Logistics KPIs for Performance: Why They Matter
In fast-paced supply chains across the US, Canada, Europe, Asia, and Australia, measuring the right mix of logistics KPIs transforms guesswork into smart decisions. You can’t manage what you don’t measure, but choose wisely, and performance follows.
The Hidden Risk of Tracking Too Many KPIs
Many logistics teams track dozens of numbers and still struggle to improve performance. The problem is not lack of data. The problem is focus.
More KPIs often create more noise. Dispatch watches one set of metrics. Finance watches another. Sales follows a third. No single view connects service quality with real cost.
Effective teams separate KPIs into three buckets:
- Customer promise metrics like OTIF and claims
- Operational efficiency metrics like dwell and utilization
- Financial outcome metrics like margin per load
When these categories stay disconnected, decisions conflict. A lane can look efficient to operations and unprofitable to finance at the same time. Strong KPI design forces those conversations early and prevents surprises at month end.
Read more: How to Build a Risk-Resilient Freight Network in 2026
Key Operational Metrics to Track
1. On-Time In-Full (OTIF) Performance
This customer-centric metric reflects delivery accuracy across time and quantity, offering a single view of across-the-board reliability.
Read more: OTIF In The Supply Chain
2. Cost-per-Mile (Including Deadhead)
Every mile counts, especially empty ones. Knowing your real cost per mile helps pinpoint inefficiencies and routes needing cost optimization.
3. Carrier On-Time & Claims Rate
Track percentage of late loads alongside claims frequency to evaluate carrier reliability.
4. Dwell Time & Detention Exposure
Monitor dwell time by stop and flag lanes where detention risk is high, then act early to save costs.
5. Trailer Utilization Rate
Maximum asset utilization is key to profitability. Low use signals opportunity for backhaul planning or fleet right-sizing.
6. Gross Margin Per Load
Calculate profitability per shipment by factoring in line-haul, fuel, accessorials, and demurrage costs. This helps pinpoint weak lanes or clients.
Broader Metrics at a Country & Global Level
Logistics Performance Index (LPI)
A benchmark by the World Bank measuring global logistics readiness across customs, infrastructure, tracking, and timeliness.
Turning KPIs into Daily Decisions
A KPI only matters when it changes behavior. Many dashboards show beautiful charts that nobody uses on Tuesday morning.
To make KPIs practical, link each metric to a clear action:
- If OTIF drops below target, trigger a carrier review for that lane
- If dwell exceeds threshold, adjust appointment rules at that facility
- If margin per load turns negative, pause tenders and reprice
- If cost per mile rises, rebalance backhaul planning
The goal is faster decisions with less debate.
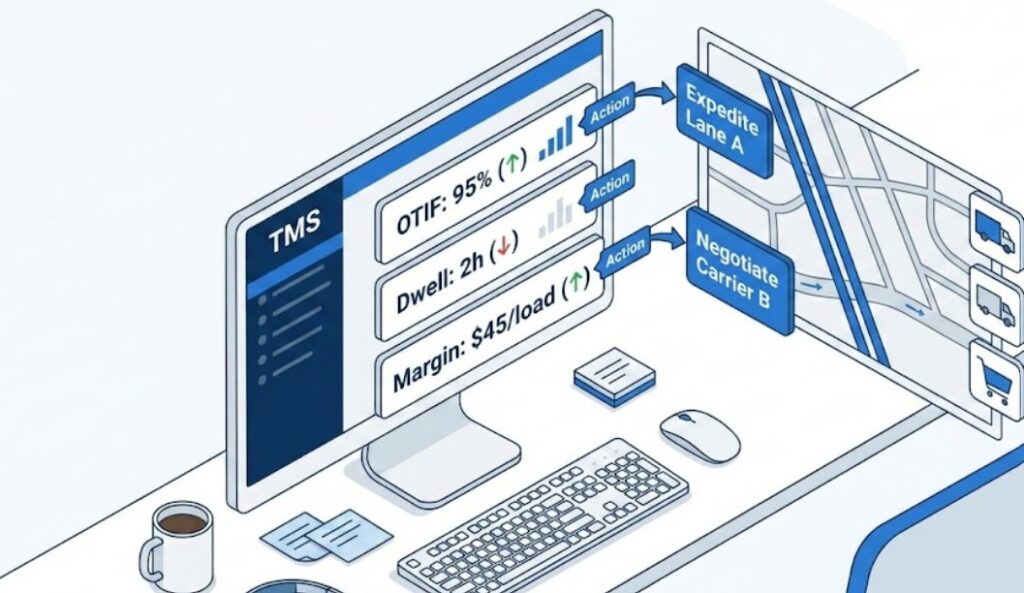
Teams that connect KPIs to specific playbooks reduce meetings, reduce finger pointing, and correct problems within days instead of quarters.
Action Steps with FTM
FTM’s TMS isn’t just about tracking, it’s built to elevate these logistics KPIs for performance:
- Custom Dashboards & Automated KPI Reports
- Alerts for Performance Exceptions
- Integrated Load & Carrier Data
- Lane & Customer Profitability Analytics
What You Should Do Now
- Identify 5–7 KPIs aligned to your operations and customers’ expectations
- Update them weekly to spot trends, seasonality, or inefficiencies
- Use a TMS like FTM to automate tracking, get alerts, and monitor lane health
Final Words
Transform your measurement mindset into measurable impact.
Request a demo and start razor-sharp tracking today.