Most carriers are sitting on a goldmine of operational data. The problem is not access. It is focused.
Dispatchers watch loads. Owners watch revenue. Finance watches cash. Everyone is busy. Very few teams step back and ask, “Which numbers actually tell us if the business is healthy?”
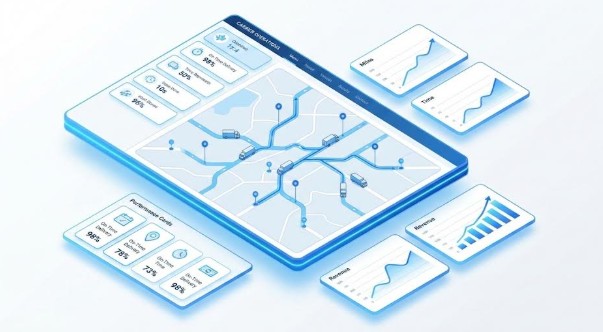
A modern TMS collects far more than load status. It captures dwell time, deadhead, driver utilization, tender behavior, billing cycles, and more. The carriers that win over the next few years will not be the ones with the most trucks. They will be the ones who understand their numbers and act on them.
This checklist covers the ten metrics that matter most for carriers who want control over margin, service, and growth.
You do not need a data science team to track these. You need a TMS that surfaces them clearly and a habit of reviewing them weekly.
1. Revenue per Mile
This is the most basic profitability signal and one of the most misunderstood.
Track revenue per loaded mile and total mile. The gap between the two reveals how much deadhead is eroding your margin.
A carrier with strong rates but poor routing often earns less per mile than a carrier with modest rates and tight execution.
What to watch:
- Trend by lane
- Trend by customer
Change after re-bids or network changes
2. Deadhead Percentage
Deadhead is not always avoidable. But it should always be visible.
Many fleets only discover deadhead problems when cash feels tight. By then, the damage is already done.
Your TMS should calculate:
- Empty miles between loads
- Empty miles returning to base
- Deadhead by lane and region
Set a target range and review outliers. A few bad lanes can quietly sink overall performance.
Read More: Deadhead Miles Explained How To Boost Fleet Profitability
3. On-Time Pickup and Delivery
Track pickup and delivery performance separately. A carrier can be strong at one and weak at the other.
Segment by:
- Customer
- Lane
- Driver
- Facility
Patterns here often point to appointment rules, dock behavior, or dispatch timing issues.
4. Dwell Time
Dwell time is one of the most expensive invisible costs in trucking.
Every hour a driver waits is:
- Lost utilization
- Higher driver frustration
- Increased risk of turnover
Your TMS should show:
- Average dwell by facility
- Dwell by customer
- Dwell by driver
This data strengthens detention claims and supports smarter customer conversations.
5. Driver Utilization
Trucks do not generate revenue. Drivers do.
Driver utilization measures how much of a driver’s available time is spent moving freight versus waiting, repositioning, or idle.
High-performing carriers track:
- Miles per driver per day
- Loads per driver per week
- Idle time between assignments
Low utilization often points to dispatch bottlenecks, poor pre-planning, or network imbalance.
6. Load Acceptance Rate
This metric reveals whether your network is aligned with your operation.
If your acceptance rate is low, something is off:
- Rates are misaligned
- Lanes do not fit your assets
- Dispatch is overloaded
- Timing is unrealistic
Tracking this by lane and customer shows where your operation and sales strategy are misaligned.
Read More: How Do Carriers Boost Load Acceptance Rates?
7. Cost per Load
Revenue is only half the story.
Cost per load should include:
- Driver pay
- Fuel
- Tolls
- Maintenance allocation
- Accessorial impact
When this number rises while revenue stays flat, margin disappears quietly.
A strong TMS links cost drivers directly to each load so trends appear early, not after the month closes.
8. Invoice Cycle Time
Cash flow is operational performance.
Track:
- Days from delivery to invoice
- Days from invoice to payment
- Exceptions that delay billing
Long invoice cycles are often caused by missing documents, manual workflows, or inconsistent processes.
Faster billing improves cash without adding trucks.
9. Claims and Service Exceptions
Most carriers track claims only when a customer complains.
A better approach is to track:
- Frequency of service failures
- Root cause by lane or customer
- Financial impact over time
This turns service quality into an operational metric instead of a reputation risk.
10. Margin by Customer and Lane
Top-line growth hides weak business.
A carrier can grow revenue while losing money on a portion of the network.
Your TMS should allow you to see:
- Margin by customer
- Margin by lane
- Margin by equipment type
This is the data that drives real strategy. It shows where to invest and where to exit.
Read More: Top 7 KPIs for Freight Managers to Track Weekly
How to use this checklist
You do not need to build a custom BI stack.
Start with three habits:
- Review these metrics weekly
- Pick one to improve each quarter
- Tie operational decisions to changes in the numbers
Carriers that do this consistently outperform those that rely on experience alone.
How we can Help you with FTM
FTM is designed to surface operational and financial performance in one place.
Carriers using FTM can track these metrics across loads, drivers, customers, and lanes without stitching data together manually. That means faster insight, better decisions, and fewer surprises.
If you want to see how your operation performs against this checklist, now is a good time to review whether your current TMS gives you these answers easily.
👉 Learn more at ftm.cloud or book a quick demo to map your data to these metrics.