Most logistics teams believe their routing is already optimized.
Routes look efficient. Carriers are negotiated. Margins feel acceptable.
Then the numbers tell a different story.
This is the story of how one mid-sized shipper uncovered$50,000 in annual TMS cost savings by tightening planning discipline, eliminating hidden waste, and connecting execution to finance.
The improvements were not dramatic. They were structural.
The starting point: “We already run tight.”
The company operated across five states. About 120 outbound loads per week. Mix of contract and spot carriers.
On-time delivery was decent. Carrier relationships were stable. No major service failures.
But margin per load was inconsistent. Finance saw fluctuation that operations could not explain.
They implemented a TMS to gain visibility. The goal was not transformation. The goal was clarity.
What they found surprised them.
Problem 1: Deadhead was invisible
Before the TMS, dispatch tracked loaded miles. Empty repositioning was not measured consistently.
Once the system calculated total miles versus loaded miles, the team saw the gap.
The average deadhead sat at 14 percent. Some lanes exceeded 20 percent.
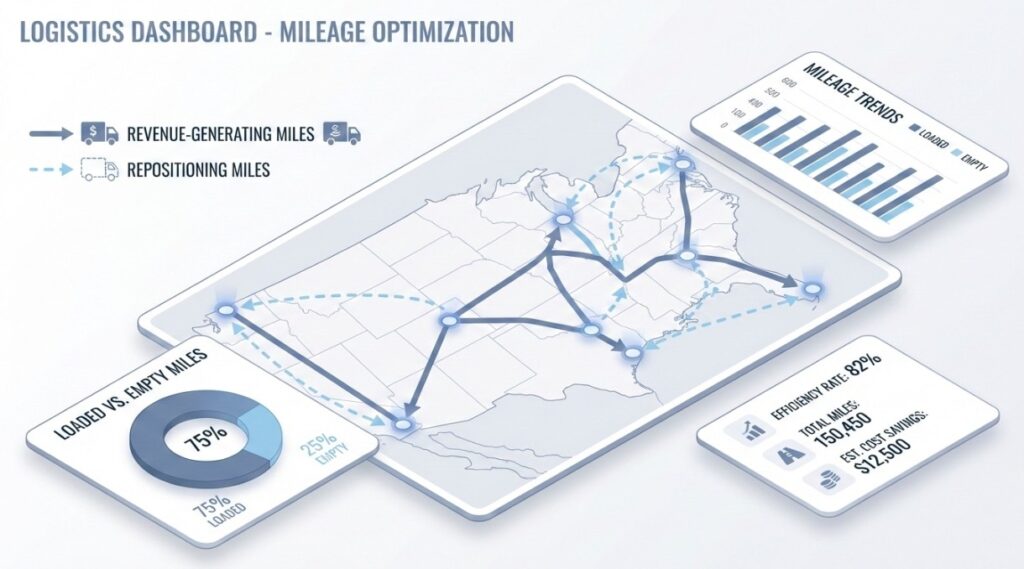
By rebalancing backhaul planning and adjusting carrier assignment by region, they reduced deadhead by 4 percent.
That alone delivered roughly $18,000 in annual TMS cost savings.
Small percentage. Large impact.
Read More: Deadhead Miles Explained How To Boost Fleet Profitability
Problem 2: Carrier performance was assumed, not measured
The team relied on long-standing carrier relationships.
After six months of tracking on-time pickup, delivery variance, and tender acceptance inside the TMS, patterns emerged.
Two carriers showed:
- Higher rejection rates on peak days
- More dwell time at specific facilities
- Increased accessorial charges
Reallocating volume to stronger performers reduced detention and re-tender costs.
Estimated impact: $11,000 in additional TMS cost savings.
The system did not replace carriers. It replaced assumptions.
Read More: Carrier Portal for Faster Freight Operations
Problem 3: Routing logic lived in memory
Transit times were based on habit. Dispatchers relied on experience.
The TMS introduced standardized transit rules and route optimization.
Result:
- Fewer last-minute reassignments
- Better alignment with appointment windows
- Reduced late-day scrambling
Operationally, stress dropped. Financially, late penalties and premium freight declined.
Estimated savings: $9,000 annually.
Problem 4: Accessorial creep
Fuel, detention, layover, and minor surcharges blended into monthly totals.
Once the TMS tied accessorials directly to load-level performance, trends surfaced.
The team identified:
- Repeated detention at one warehouse
- Inconsistent fuel surcharge application
- Duplicate small fees
Addressing these reduced cost leakage.
Impact: approximately $7,000 in TMS cost savings.
Problem 5: Invoice cycle delays
Billing lag averaged 12 days after delivery.
The TMS enforced document requirements before invoice release.
Cycle time dropped to 6 days.
Faster billing improved cash flow and reduced manual follow-up effort.
Financial modeling estimated working capital impact equivalent to $5,000 in annualized TMS cost savings.
Read More: Why Cargo Gets Flagged at Customs & How to Avoid Delays
Total impact
None of these changes felt dramatic.
No new fleet. No new contracts. No layoffs.
Just structured planning, visibility, and disciplined measurement.
Combined impact:
- Deadhead reduction: $18,000
- Carrier optimization: $11,000
- Routing discipline: $9,000
- Accessorial control: $7,000
- Billing efficiency: $5,000
Total: $50,000 in annual TMS cost savings.
The lesson is simple.
Most cost problems hide in daily friction, not strategic failure.
What made the difference
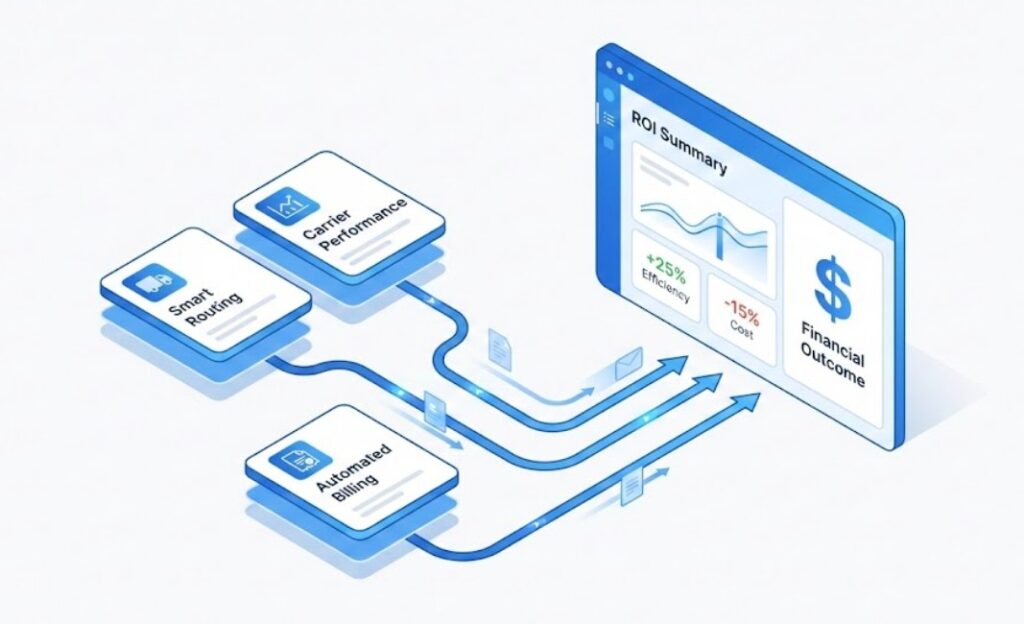
The TMS did three things:
- Exposed hidden inefficiencies
- Connected operational data to financial impact
- Turned recurring problems into measurable signals
The company did not need more trucks. They needed better visibility.
Why routing alone is not enough
Routing optimization is important. It reduces miles and improves predictability.
But routing without carrier performance data, accessorial tracking, and invoice discipline leaves savings unrealized.
True TMS cost savings come from linking:
- Planning
- Execution
- Exception management
- Financial reporting
When these layers operate together, small improvements compound.
Read More: How to Choose a TMS?
What this means for your operation
If you move freight weekly, inefficiencies exist.
Not because your team lacks skill.
Because manual processes hide patterns.
Ask yourself:
- Do you know your true deadhead percentage?
- Do you measure margin by lane?
- Do you track detention trends by facility?
- Do invoices reflect load-level reality?
If not, your opportunity looks similar.
From routing to measurable ROI with FTM
FTM connects routing, carrier performance, accessorials, and billing into one structured workflow.
You gain visibility at the load level. You see where cost leaks. You act early.
TMS cost savings do not come from one dramatic change. They come from disciplined control across daily operations.
If you want to see where $50,000 might be hiding in your network,