The US freight market outlook for mid-2026 is no longer a story of uniformly cheap capacity. Truckload pricing has moved sharply higher, LTL carriers are still holding yield, and intermodal is gaining share as shippers look for alternatives to expensive over-the-road capacity.
As of August 2026, the most important signal is that rate pressure is being driven as much by capacity as by demand. In June, DAT reported that dry van spot rates exceeded contract rates for the first time since February 2022. Reefer spot pricing also moved above contract, while flatbed remained expensive even after the spot-contract gap narrowed.
For shippers, that changes the procurement question. The priority is no longer simply finding the lowest rate. Instead, teams need to decide which lanes should stay contracted, where spot exposure is becoming dangerous, and where mode conversion can protect service and budget.
The Mid-2026 Freight Market in One View
Freight demand has not exploded across every segment. However, available capacity has tightened enough to give carriers more pricing power in several truckload markets.
DAT’s June averages put dry van spot at $3.00 per mile, reefer at $3.39, and flatbed at $3.69. Compared with June 2025, linehaul rates were up 45% for van, 39% for reefer, and 40% for flatbed. Meanwhile, freight volumes were flat to lower year over year across the same equipment types.
That combination matters. When rates rise much faster than volume, the market is telling shippers that supply is the constraint.
At the same time, LTL pricing remains firm, while intermodal is absorbing more freight on lanes where transit requirements allow it. Therefore, the second half of 2026 is likely to reward shippers that manage rates lane by lane instead of treating the market as one national average.
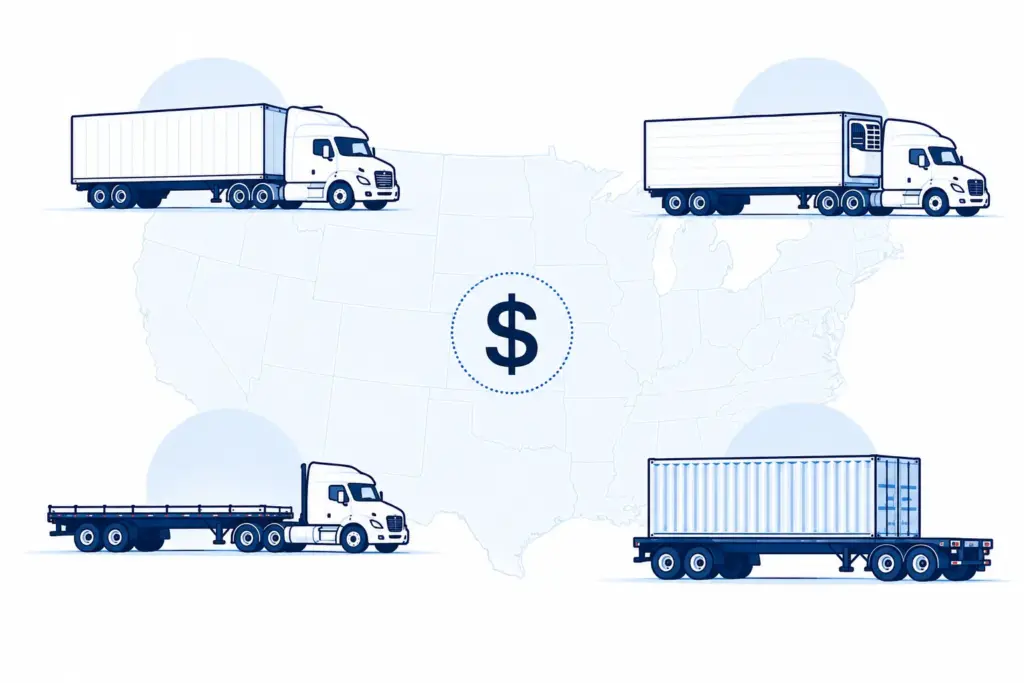
Dry Van: The Spot Market Has Regained Pricing Power
Dry van is the clearest sign that the truckload cycle has changed.
In June, DAT reported a national average spot van rate of $3.00 per mile versus a $2.89 contract rate. It was the first month since February 2022 in which national van spot pricing exceeded contract pricing.
That does not mean every contract is suddenly unattractive. Contract rates still provide predictable capacity, routing-guide stability, and less exposure to daily volatility. However, the relationship between the two markets has changed.
What shippers should watch
First, measure spot exposure by lane rather than across the network. A shipper with 8% spot usage can still have a serious problem if that exposure is concentrated in a few high-volume or service-critical lanes.
Second, watch primary carrier acceptance. Rising spot rates often appear operationally before they appear in a procurement report because contracted carriers begin rejecting more freight.
Finally, compare current market pricing against your lane history before opening a bid. FTM’s Quoting System keeps lane history, pricing context, and transportation data connected, which makes rate changes easier to evaluate against actual operating history.
Reefer: Higher Rates and Higher Volatility
Refrigerated freight entered mid-2026 with even less room for complacency.
DAT’s June average reefer spot rate reached $3.39 per mile, compared with a $3.22 contract rate. In addition, reefer linehaul pricing was 39% higher than a year earlier.
Seasonality makes reefer especially difficult to manage through national averages. Produce regions, weather, temperature requirements, dwell time, and regional imbalances can move pricing quickly even when national freight demand looks moderate.
What shippers should do differently
For recurring temperature-controlled lanes, protect core capacity earlier and avoid relying on a late spot-market rescue.
Also, separate price variance from service variance. Paying more for a carrier that consistently protects appointments, temperature requirements, and claims performance can be cheaper than buying a lower rate that creates downstream failures.
For overflow freight, maintain a qualified backup network before the lane becomes urgent. A private carrier network gives transportation teams a controlled way to expose freight to approved carriers instead of sourcing from scratch every time capacity tightens.
Flatbed: Still Expensive Even After Summer Easing
Flatbed has been one of the strongest pricing markets of 2026.
DAT’s June average spot rate reached $3.69 per mile, while the contract average was $3.80. Unlike van and reefer, contract flatbed still carried a premium. Yet the gap had narrowed dramatically.
By early August, weekly flatbed linehaul had eased from July highs but remained almost 40% above the prior year. Therefore, a small week-over-week decline should not be confused with a return to the soft conditions of 2024 or 2025.
The procurement implication
Flatbed shippers should focus on network balance, equipment requirements, and origin-specific capacity.
Construction materials, machinery, metals, and project freight create geographic pockets where a national benchmark tells very little about the rate a shipper can actually buy.
As a result, procurement teams should track market rate, tender acceptance, lead time, and service performance together. The FTM Dispatch Console keeps execution events, carrier activity, exceptions, and financial signals attached to the same live load record.
LTL: Pricing Discipline Is Holding
LTL has not followed the same pattern as truckload, but pricing remains firm.
XPO reported that North American LTL yield excluding fuel increased 4.4% year over year in the second quarter of 2026. Shipments per day increased 2.8%, while tonnage per day increased 1.0%. Those are company results rather than a national LTL index, but they provide a useful signal on the pricing environment.
That distinction matters because LTL pricing is less transparent than truckload spot pricing. Classification, density, dimensions, minimum charges, accessorials, service level, and negotiated tariffs can all move the effective cost of a shipment.
Why the invoice can matter as much as the quote
For LTL, a cheap base rate can be overwhelmed by reclassification, limited-access charges, liftgate service, residential delivery, redelivery, or other accessorials.
Therefore, shippers should compare expected and actual cost, not just quoted linehaul. FTM’s Billing and Reporting keeps tariff-based pricing, accessorials, carrier costs, invoices, and shipment-level financial history connected so teams can see where final cost moved away from the original plan.
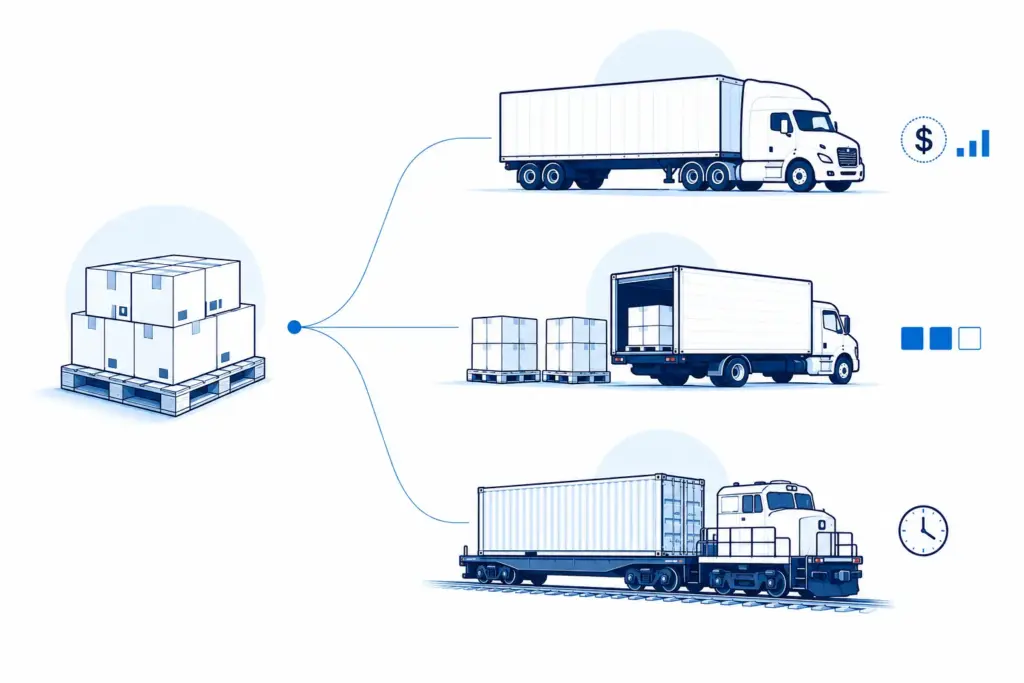
Intermodal: The Value Proposition Is Getting Stronger
Intermodal is benefiting from the increase in truckload cost.
J.B. Hunt reported second-quarter 2026 intermodal volume up 10% year over year. Gross revenue per load increased 11%, although revenue per load excluding fuel increased only 1%. The company attributed stronger demand partly to higher fuel prices and constrained driver and capacity availability in other transportation modes.
That does not make intermodal the right answer for every lane.
Transit time, dray capacity, proximity to ramps, shipment value, service sensitivity, and network consistency still determine whether conversion works.
However, long-haul lanes with predictable schedules deserve another look when truckload rates rise. For those lanes, intermodal does not need to beat truckload on every dimension. It needs to deliver an acceptable service level at a lower total transportation cost.
Mid-2026 Rate Trends by Mode
| Mode | Mid-2026 Signal | Rate Evidence | Shipper Response |
|---|---|---|---|
| Dry Van | Strong upward pressure | June spot $3.00/mi vs. contract $2.89/mi; linehaul +45% YoY | Protect core lanes and monitor spot exposure and primary-carrier acceptance. |
| Reefer | Elevated and volatile | June spot $3.39/mi vs. contract $3.22/mi; linehaul +39% YoY | Secure recurring capacity early and maintain qualified backup carriers. |
| Flatbed | Historically expensive | June spot $3.69/mi vs. contract $3.80/mi; linehaul +40% YoY | Manage pricing by origin, equipment requirement, and network balance. |
| LTL | Pricing remains firm | XPO Q2 yield excluding fuel +4.4% YoY | Measure total landed cost, including accessorials and classification changes. |
| Intermodal | Increasingly competitive | J.B. Hunt Q2 volume +10% YoY; revenue/load excluding fuel +1% | Re-test long-haul lanes where transit flexibility allows modal conversion. |
Truckload rates are DAT national June 2026 averages. LTL and intermodal figures are public-carrier indicators rather than national rate benchmarks.
The important point is not which arrow points up.
It is where the economics have changed enough to justify a different procurement decision.
What Is the US Freight Market Outlook for the Rest of 2026?
The second half of 2026 is unlikely to behave like the prolonged soft truckload environment that preceded it. July brought some seasonal cooling, but capacity remained tight and transportation pricing remained elevated.
Contract bids will need better lane intelligence
If spot remains near or above contract on key truckload lanes, carriers will have less incentive to accept aggressive annual bid reductions.
Consequently, procurement teams should enter renewals with lane-level acceptance, volume consistency, dwell, lead time, and service data. A lane that is operationally expensive for the carrier will be difficult to fix with negotiation alone.
Mini-bids may become more useful
A full annual RFP can lock in assumptions that become stale quickly.
Instead, targeted mini-bids can address lanes where rates or service have moved materially while leaving stable awards alone. This approach reduces unnecessary churn and gives shippers a faster response to market changes.
Mode conversion deserves a financial threshold
Do not simply tell planners to “use intermodal more.” Define when the conversion becomes attractive.
For example, set acceptable transit variance, minimum savings, distance, origin-destination constraints, and shipment characteristics. Then let planners compare eligible alternatives consistently.
FTM’s integration ecosystem connects transportation workflows with rating, load-board, visibility, ERP, telematics, and accounting systems so market decisions can be made with operational context rather than in a separate spreadsheet.
The Best 2026 Rate Strategy Is Not One Rate Strategy
National averages are useful for understanding direction. They are weak procurement policies.
A shipper may need to protect reefer capacity, renegotiate a flatbed lane, shift a long-haul van lane to intermodal, and leave a stable LTL tariff untouched during the same week.
Therefore, the best freight strategy for the rest of 2026 is segmented.
Use contract capacity where service continuity matters. Use spot selectively where the network can tolerate volatility. Test intermodal where the service-cost tradeoff works. Most importantly, measure actual landed transportation cost rather than assuming the lowest quoted rate produced the best outcome.
The FTM shipper platform brings shipment execution, carrier performance, freight spend, lane history, documents, and reporting into the same Salesforce environment. Meanwhile, the broader FTM platform connects quoting, dispatch, financial visibility, automation, and integrations through one transportation data model.
When market conditions change quickly, that connected history matters. Procurement can see what a lane cost, operations can see what happened, and finance can see what the decision ultimately produced.
Mid-2026 Freight Market Takeaways
For dry van, spot pricing has crossed above contract nationally, so shippers should watch routing-guide performance and spot exposure closely.
For reefer, pricing is elevated and regional volatility remains important. As a result, dependable capacity matters more than chasing the lowest national benchmark.
For flatbed, rates remain historically high even after some summer easing. Origin-specific capacity and equipment requirements should drive procurement decisions.
For LTL, carrier pricing discipline remains firm, while accessorial control and actual cost measurement are essential.
For intermodal, stronger demand confirms that more shippers are reconsidering rail as truckload economics change.
The market has moved from “capacity is easy to buy” toward a more selective environment. Shippers that can compare rates, service, carrier performance, and mode options on the same lane will have a meaningful advantage in the second half of 2026.
Frequently Asked Questions
See What Your Freight Is Actually Costing by Lane
FTM connects rates, carrier performance, shipment execution, freight spend, and reporting so your team can make procurement decisions with the full transportation history in view.
Book a Shipper Demo